Articles
50 Years After Bretton Woods : Can The Greenback's Resilience Continue?
Technically, the dollar has shown to be more resilient than we anticipated. We predicted that the rebound that began in mid-July would finish around the time of the US CPI report. Momentum indicators are stretched, and some have begun to trend lower for the dollar, but price action has yet to support our worries.
50 Years After Bretton Woods: Can the Greenback's Resilience Continue?
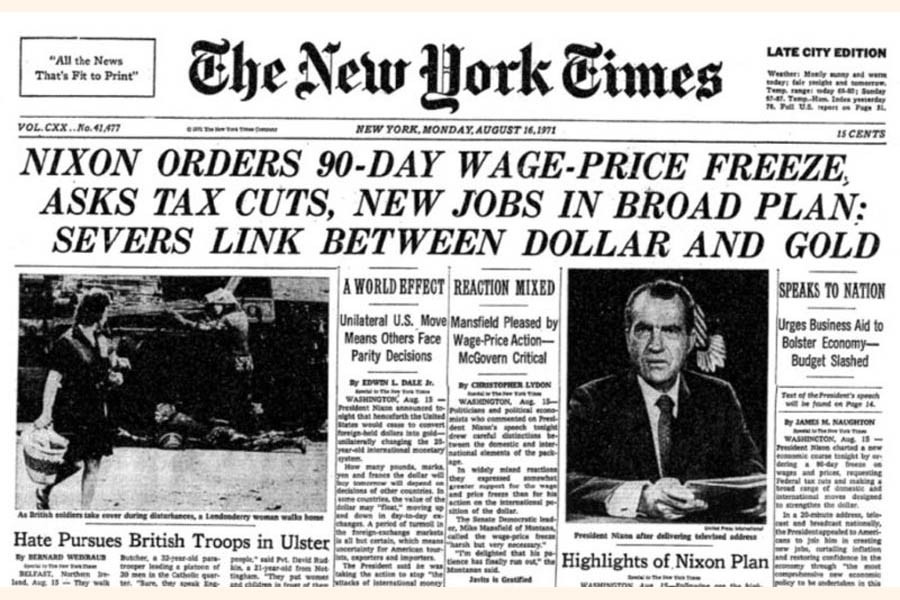
The collapse of the Bretton
Woods currency agreement, which tied the dollar to gold and other currencies to
the dollar, is commemorated on Tuesday for the 52nd time. Some economists have
attempted to frame their views in terms of Bretton Woods II, and some have even
advocated for Bretton Woods III, but these are at most informal arrangements
with no reciprocity or mutual duties. The point is that the fall of Bretton
Woods heralded the contemporary age of floating currencies, which has resulted
in unpredictable exchange rates.
Hegemonic stability theory is
a big picture concept in international affairs. It believes that capitalism
works best when one country sets and enforces international rules of
engagement. The attempts to revive Bretton Woods miss the insight gained by Ian
Bremmer's "G-Zero" notion. Bretton Woods was made feasible by the
unsustainable power disparity that existed in 1944.
Since the end of the Soviet Union, the US has moved away philosophically from fixed exchange rates and embraced market fundamentalism, and this power imbalance has not occurred for decades. The current low double digit actual (historic) three-month volatility of the Scandi and Antipodean currencies is the result of letting markets determine exchange rates. The other G10 currencies' volatility ranges from roughly 6% for the Canadian dollar to 9% for the Japanese yen.
Because of the volatility,
businesses and investors must account for currency fluctuations and manage the
risk. Short-term changes are typically explained by emphasizing the flow of
economic news, surprises, and technical reasons. A few data items will be
concentrated in the coming week. The United States, for example, publishes July
retail sales, as do China, the United Kingdom, and Mexico. The United States,
China, and the Eurozone all release their most recent industrial production
numbers. Japan, the United Kingdom, and Canada release July CPI figures, while
the United Kingdom and Australia release new labor market data.
Technically, the dollar has
shown to be more resilient than we anticipated. We predicted that the rebound
that began in mid-July would finish around the time of the US CPI report.
Momentum indicators are stretched, and some have begun to trend lower for the
dollar, but price action has yet to support our worries.
United States: After declining in Q1 and Q2 of this year, the US economy has been expanding faster than the Fed's non-inflationary rate of 1.8% for the past four quarters. According to the Atlanta Fed's GDP tracker, the economy will accelerate to more than twice the speed limit in Q3. Three reports that highlight the upcoming week are projected to increase sequentially from June. Bloomberg's survey predicts that retail sales will have increased by 0.4%, following a 0.2% increase in June.
However, the core group used by some GDP estimates, which excludes automobiles, petrol, building materials, and food services, may decline from 0.6% in June to 0.4%. Housing starts fell 8% in June and are expected to level off in July. Permits are also expected to have levelled off after declining 3.7% in June. Finally, industrial output fell by 0.5% in June but presumably recovered the majority of that in July. The market's expectation that the economy will decline from 2.4% in Q2 to 0.6% in Q3 is based in part on a halving of consumer growth (1.6% in Q2 and 0.8% here in Q3) and a substantial drop in private investment (from 5.7% in Q2 to -1.1% in Q3).
This week's reports have a direct impact on both. At the same time, the soft-landing scenario does not appear to be challenged in the coming days, implying that a September rate hike is unlikely.
The Dollar Index is nearing the top of its recent range. It closed above 102.75, which is a critical level from a technical standpoint. It represents both the (38.2%) retracement of losses from the year's high (105.90) in early March and the (61.8%) retracement of losses since the May 31 high (104.70).
The Dollar Index has taken out the trend line connecting the May, July, and early August highs (starts the new week around 102.45 and concludes the week near 102.25). The MACD continues to rise, while the Slow Stochastic has stopped but has yet to fall. The 200-day moving average and last month's high are located at 103.00 and 103.40-60, respectively. A break of 101.60-75 would aid in the confirmation of a peak.
China has taken more steps this year to make its economic data less accessible. When China is not being deliberately opaque, the market has long been skeptical of the accuracy of its economic data and reports. "Multiple local brokerage analysts and researchers at leading universities as well as state-run think-tanks said they had been instructed by regulators, their employers, and even domestic media outlets to avoid speaking negatively about topics ranging from fears of capital flight to softening prices," according to the Financial Times.
China has reported Industrial output, retail sales, property investment, property sales, and the measured unemployment rate were all up in July. Even if the data had greater credibility, it has been rendered largely irrelevant by the Politburo's acknowledgment of the need for more economic support. There could be two main takeaways. First, current efforts are insufficient, and the housing market remains broken. Second, officials acknowledge the unhappiness by strengthening repression in an exercise of affirmation-through-negation.
The PBOC is anticipated to raise the volume of funds available under the one-year medium-term loan facility while maintaining the rate at 2.65%. The CSI 300 fell 2.3% ahead of the weekend as a result of the bad July lending numbers, the worst drop since last October. A reduction in reserve needs appears to be an option, albeit the timing is unknown.
The dollar's resiliency, combined with negative Chinese statistics (soft prices, decreasing exports, and sluggish lending), keeps the Yuan under pressure. The dollar gained over CNY7.24 last week, the greatest rise in Q3 thus far. The PBOC's interventions continue to assist curb the dollar's ascent. Last month's high was near CNY7.2550, while the year's high was near CNY7.2690 at the end of June. The greenback reached around CNY7.3275 in November 2022. Chinese officials could scale up their efforts, but the move appears to be about the dollar rather than the Yuan, and with deflationary factors at work, there is no rush to turn the Yuan around.
Japan: Slower wage growth and weaker consumer demand reduced the pressure on the country's government bonds. Prior to the BOJ decision last month, the generic 10-year JGB yield was approximately 0.45%; it is now almost 0.66%. In the first week of August, the BOJ intervened twice to purchase government bonds, but it did not do so last week.
The majority of the economic statistics coming out of Japan in the next days won't reveal much new information on how the third-largest economy in the world is doing economically. Although it will largely be accounted for by net exports, the preliminary estimate for Q2 GDP appears to be in line with the Q1 performance of 0.7%. Investment in businesses and consumption both seem to be declining. The GDP deflator is predicted to increase from 2.0% to 3.8% on an annual basis. The release of Tokyo's July data steals much of the spotlight, despite the fact that the national CPI may garner interest. The headline CPI for Tokyo held unchanged at 3.2%.
The core rate, which includes fresh items, fell from 3.2% to 3.0%. The cyclical high for the metric that excludes fresh food and energy is 4%. The fresh information may be centered on the July trade numbers. Seasonal tendencies point to a decline from the JPY43 billion surplus reported in June. In 14 of the last 20 years, the July trade balance has declined. Even so, it may not reveal anything about the Japanese economy. The drop in imports (12.9% year on year in June) reflects lower commodity prices, whereas the drop in exports (1.5% year on year in June) reflects weaker demand (and Chinese penalties).
The dollar concluded the week on a firm note near JPY145, which may have traded before the weekend. At the end of June, the year's high was slightly above JPY145. Above there, the JPY146.00-15 region may see some resistance, but significant opposition does not appear until closer to JPY150 (last year's high was nearly JPY152). A closure below JPY143.80 may be required to indicate that the dollar's rally from approximately JPY137.25 in mid-July has ended. This would appear to imply that US 10-year yields will also peak soon. On August 4, the year's high was near 4.20%.
United Kingdom: Following a lower-than-expected June CPI, market expectations for the BOE meeting in September have been reduced. The UK will release the July CPI, job and salary data, and retail sales data in the following days. Last year, from June to October, the UK CPI grew at an annualized pace of roughly 10%. As the high monthly prints are replaced by smaller rises, the year-over-year rate, which peaked at 11.1% in October and was still at 10.1% in March, is expected to decline further.
The Bank of England anticipates a 5% interest rate by the end of the year. In June, it stood at 7.9%. The labor market's tightness and the increase in average weekly earnings (6.9% in May 3-months year-over-year), a new cyclical high, will be closely monitored. However, although real wages in the United States have been rising, weekly earnings in the United Kingdom have been rising at a slower rate than inflation. This could explain why household spending increased by only 0.2% in Q1 and remained flat in Q2. Nonetheless, average weekly wages appear to have increased for the fourth month in a row in June.
Separately, the payroll figure may have dropped for the second month in a row. Retail sales (reported in volume terms in the UK) are a more specific statistic than household consumption. Next week will also see the reporting of July retail sales. In Q2, the average monthly gain was 0.4%, the highest in a quarter in two years. Given the views of BOE officials, we believe that employment and CPI data will dominate retail sales.
Eurozone: The next batch of Eurozone statistics will be of little interest to the market, and what defines the forecast for the ECB meeting next month will not be found in June data: trade, industrial, and construction output, as well as a second look at Q2 GDP and quarterly employment figures. Germany is watching the August ZEW investor poll, but it is unlikely to alter the needle. The current scenario is simply overestimated.
It has been bad since the end of 2021. This year's average is -47.6, which is nearly twice as bad as the same time last year. Beginning in March 2022, the expectations component was negative. It recovered in January through April of this year, but for the last three months, it has returned to being negative. The uproar brought on by Italy's proposal to tax banks immediately seems to have subsided without having a significant impact on its premium over Germany.
The euro surged above the 20-day moving average for the first time in two weeks after the US CPI, but it immediately reversed. Prior to the weekend, it was trading below $1.0945. The price movement was negative, with the euro falling for the fourth week in a row, matching the longest losing streak since March 2022. The Slow Stochastic has increased and the MACD has stabilized.
Canada: There are two negative factors. The outside world comes first. The Canadian dollar is negatively impacted by the risk-off period. Additionally, there has been a recent rise in the correlation between the S&P 500 and risk. The Canadian dollar is also susceptible to the general trend of the US dollar (represented by the Dollar Index). The second obstacle is a string of dismal Canadian dollar developments.
This covers both the July employment
report and the IVEY PMI, as well as the larger-than-expected June trade
deficit. The seven-week 21% rise in oil prices has provided little assistance
for the Canadian currency. Indeed, it has dropped by about 2% throughout the
oil rally. The July CPI is the centerpiece of the next week.
The Canadian currency rose from about CAD1.31 in mid-July to CAD1.35 last week. The trend line connecting the year's high in mid-March (CAD1.3860) and the late May high (CAD1.3650) was broken intraday, but the greenback was unable to close above it. Before the weekend, the US dollar remained below it (CAD1.3470). This is also true for the 200-day moving average (CAD1.3450): the greenback violated it intraday but respected it at the end of the day.
Australia: Several natural gas projects may experience labor
disputes, which, in some estimations, might threaten 10% of the global LNG
production capacity. The biggest consumers of LNG from the at-risk fields are
Japan and South Korea. Recent strike ballots caused reverberations in the Nat
gas market and seem to have stepped up negotiations to prevent a disruption.
Australia releases its July
employment figures on August 17. About 220k of the 255k jobs that Australia
produced in H1 were full-time positions. This contrasts with approximately 345k
and little over 365k, respectively, in H1 22. In June, the unemployment rate
was 3.5%, a little decrease from 3.6% in June 2022.
The price movement of the Australian dollar has been really terrible. Following the release of the US CPI statistics, the Aussie recovered to around $0.6615 before reversing down and recording a bearish outside down day. Prior to the weekend, follow-through selling drove it below $0.6500. The next logical target is the year's low, which was set at the end of May just under $0.6450. Breakage indicates at least $0.6400 in potential. The momentum indicators are inconsistent, as we have seen with some other currency pairs.
Mexico: The central bank of Mexico held the overnight target
rate at 11.25% despite the fact that inflation is still declining there. Since
the quarter-point increase in March, the rate has remained constant. The CPI in
March was 6.85%. It was little below 4.80% the previous month. That suggests
that actual rates are rising. Mexico's actual overnight rate is approximately
6.45% when current inflation is taken into account. Brazil's has started a
cycle of easing and has a rate of roughly 10%. The actual overnight rate in
Chile, which was reduced by 100 basis points last month, is close to 3.75%. The
biggest economic report in the coming week, June retail sales, is unlikely to
be what convinces Banxico to lower rates.
The Mexican economy grew by
1% in the first quarter and 0.9% in the second. Despite the fact that retail
sales declined by 0.4% in Q1, they are performing significantly better in Q2.
April and May saw an increase of roughly 0.8%.
Last week, the Mexican peso was one of the few currencies in the world to hold its own against the US dollar. The peso gained roughly 0.5% against the US dollar.
Related Posts
Interest Rates and Inflation Around the World: Why the UK Stands Out
Taxation affects fortunes in ways other than inflation and interest rates. Those receiving income or running businesses may have experienced increased tax bills.

Prop Connect
The Case for Preparing Now for an Inflation Overshoot
The IMF also cautioned of inflation asymmetry in its World Economic Outlook report. Several economists, including Olivier Blanchard and Kenneth Rogoff, agreed. Some of them may be willing to accept a higher inflation objective.
Prop Connect
US Inflation Moderates, Giving Fed Breathing Room
"The labour market is slowing down, giving the stickiest inflation categories a disinflationary push that should endure the rest of the year. The rate increase in July by the FOMC was probably the last one before a protracted hiatus."